An open data pipeline for transparent biotech compensation
This project leverages salary survey data collected from Reddit’s r/biotech community to explore compensation trends in biotechnology. Initially, I used this data to inform my own job search as a new graduate, but over time it became a foundation for exploring data cleaning, visualization, and interactive data science techniques.
Data Pipeline
The survey responses are collected via a Google Form, stored in a live Google Sheet, and automatically pulled weekly using GitHub Actions. An ETL pipeline (Quarto Markdown script) cleans, validates, and publishes the dataset as a flat CSV file on GitHub:
Interactive Applications
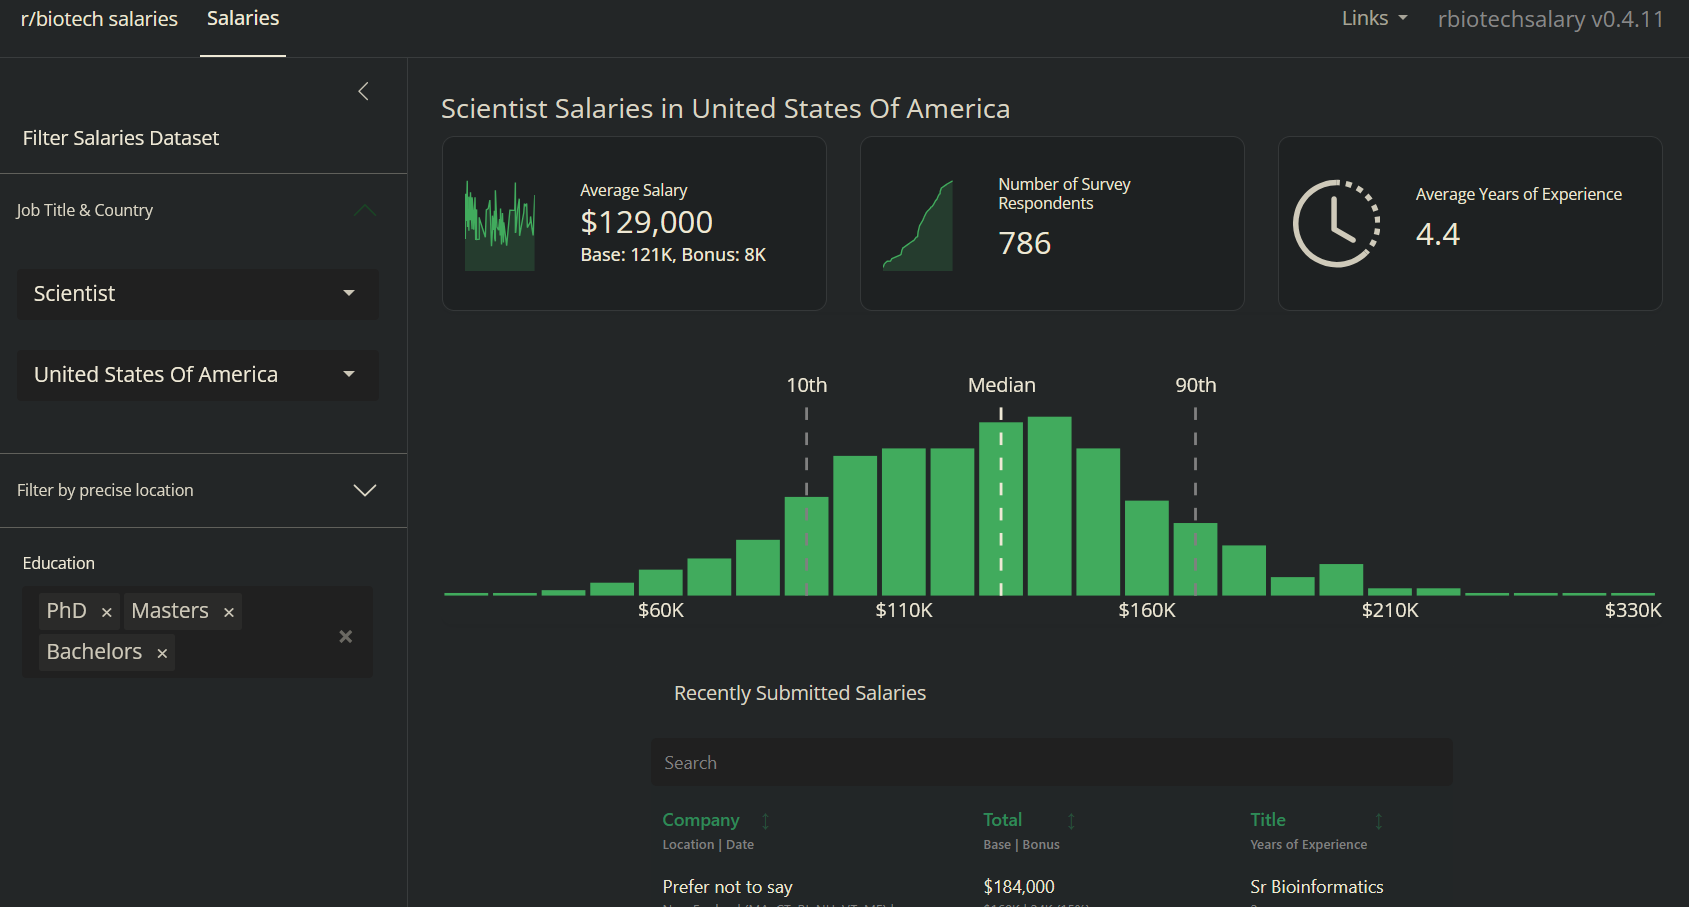
To explore and visualize the data, I developed a Shiny app deployed as a Docker container on a Digital Ocean droplet. The app reads the cleaned dataset directly from GitHub and provides:
- Interactive filters for examining salary distributions, experience, and other survey responses.
- Visualizations that allow users to explore trends by role, company type, or other factors.
This setup ensures that the dataset remains up-to-date, reproducible, and transparent while requiring minimal manual intervention.
Additionally, I have explored Observable JS dashboards as an alternative approach for interactive data exploration:
Technologies & Tools
- GitHub Actions – automated data retrieval and ETL workflow scheduling.
- Quarto – reproducible data pipeline documentation and rendering.
- Shiny & Docker – interactive web app development and containerized deployment.
- Digital Ocean – hosting for production Shiny application.
- CSV & Google Sheets – data ingestion and storage.
- Observable JS – alternative approach for interactive data dashboards.