library(bslib)
library(dplyr)
library(purrr)
library(shiny)
library(glue)
library(ggplot2)
library(palmerpenguins)
data(penguins)
ggplot2::theme_set(theme_bw(15))Programmatically creating tabsets in R

Introduction
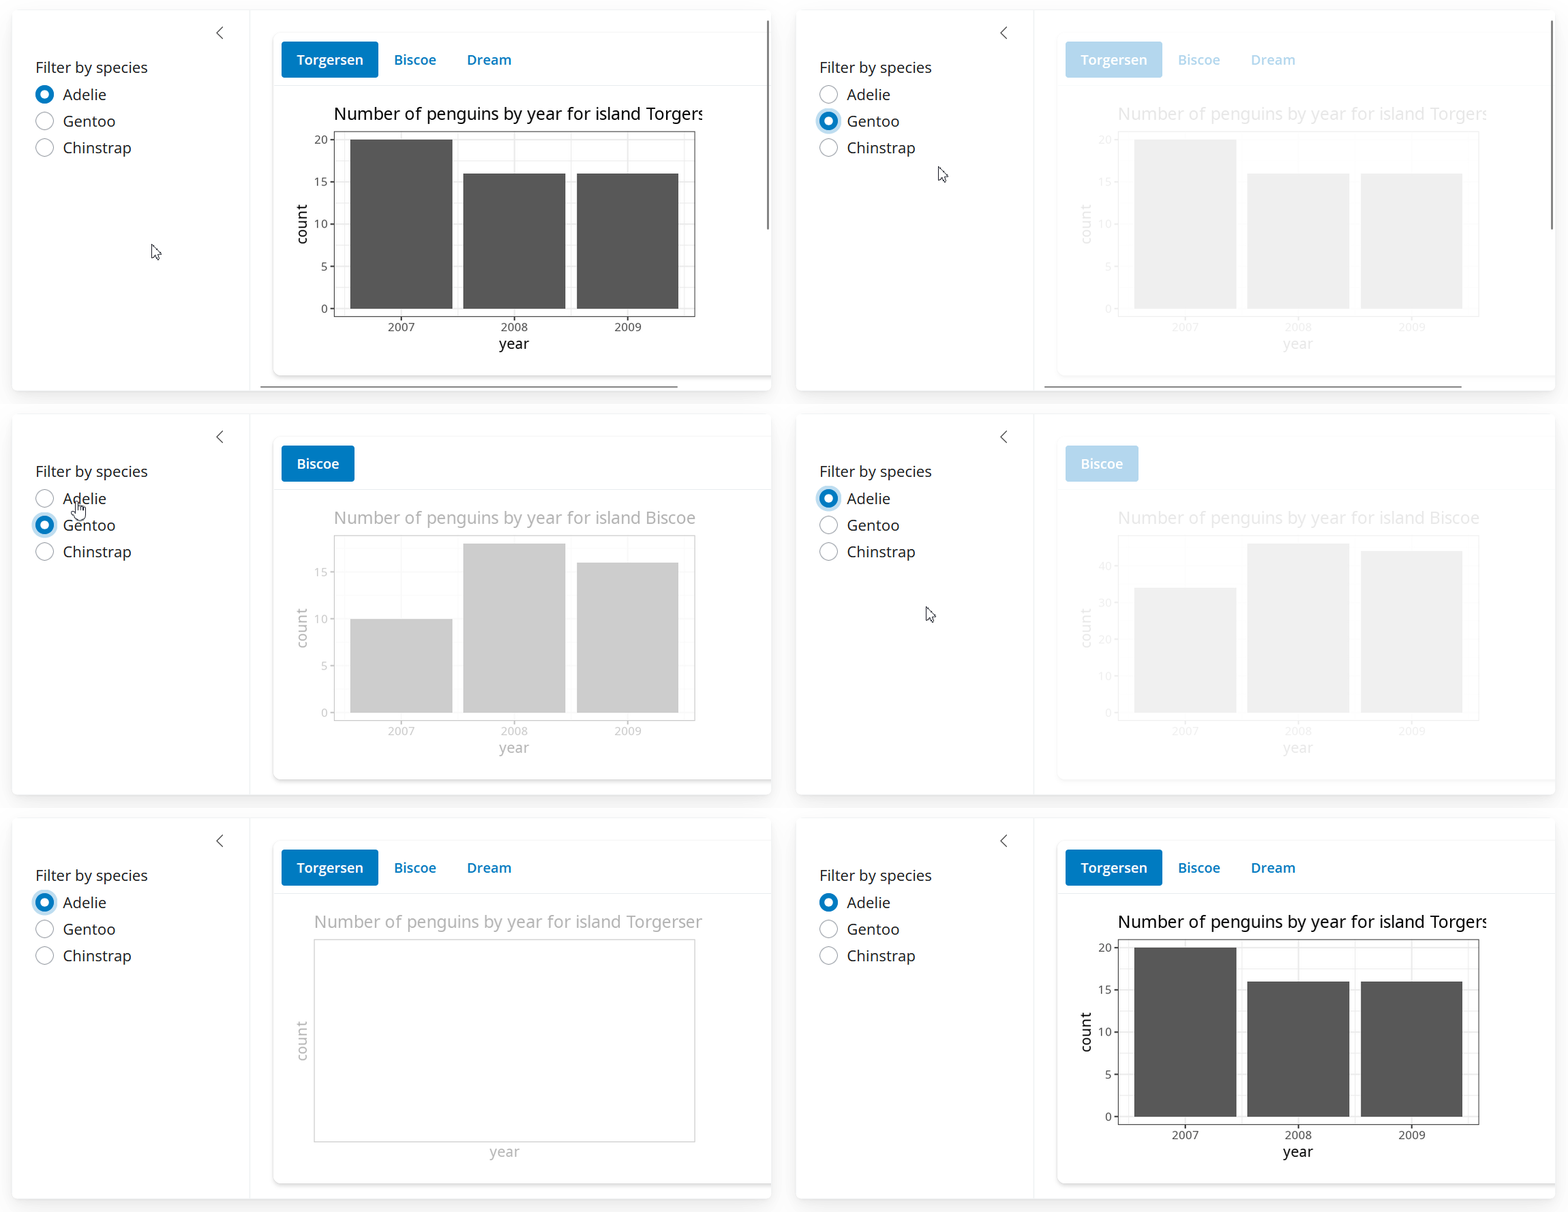
I recently was working on a web app and encountered a situation where I wanted to create tabs based on some variable in a data frame. The tab names and content would change when the data was subsetted or modified from other functions in the app.
Here is how to do that in shiny, using the palmerpenguins dataset as an example.
Setting up the UI
First I set up the ui with two components:
- an input component that filters the dataset, and
- a
uiOutputcomponent for the dynamic tabs which will be rendered server-side
The filter component is just to demonstrate how the tabsets are generated based on different subsetted versions of the underlying data.
ui <- bslib::page_fillable(
  radioButtons(
    "select_species",
    "Filter by species",
    choices = unique(penguins$species)
  ),
  shiny::uiOutput("dynamic_navset_card")
)
Render the tab names and content server-side
Next is the server code. The server code does 3 things:
- filter the penguins dataset
penguin_filtered, based on the radio buttons - dynamically render the ui component based on the
islandcolumn in the filter penguin dataset i.e.penguin_filtered$island - Create content for each tab, here I chose a histogram over year.
server <- function(session, input, output) {
  # 1. filter by species
  penguins_filtered <- reactive({
    req(input$select_species)
    penguins |> filter(species == input$select_species)
  })

  # 2. create the ui based on the `island` column
  output$dynamic_navset_card <- renderUI({
    nav_items <- unique(penguins_filtered()$island) |>
      purrr::map(
        ~ nav_panel(
          title = .x,
          plotOutput(glue("plot_{.x}"))
        )
      )
    navset_card_pill(!!!nav_items)
  })

  # 3. create the plots
  observe({
    walk(
      unique(penguins_filtered()$island),
      function(x) {
        id <- glue("plot_{x}")
        output[[id]] <- renderPlot({
          penguins_filtered() |>
            filter(island == x) |>
            ggplot(aes(x = year)) +
            geom_histogram(stat = "count") +
            labs(title = glue("Number of penguins by year for island {x}"))
        })
      }
    )
  })
}
The tricky part is figuring out how to dynamically assign the output ids. Here, I programmatically create the ids and then assign them content (plots) based on the relevant subset of data.
Shinylive app
Here is a demonstration with a shinylive app
library(bslib)
library(dplyr)
library(purrr)
library(shiny)
library(glue)
library(ggplot2)
library(palmerpenguins)
data(penguins)
ggplot2::theme_set(theme_bw(15))

ui <- bslib::page_sidebar(
  sidebar = sidebar(
    radioButtons(
      "select_species",
      "Filter by species",
      choices = unique(penguins$species)
    )
  ),
  shiny::uiOutput("dynamic_navset_card")
)

server <- function(session, input, output) {
  # 1. filter by species
  penguins_filtered <- reactive({
    req(input$select_species)
    penguins |> filter(species == input$select_species)
  })

  # 2. create the ui based on the `island` column
  output$dynamic_navset_card <- renderUI({
    nav_items <- unique(penguins_filtered()$island) |>
      purrr::map(
        ~ nav_panel(
          title = .x,
          plotOutput(glue("plot_{.x}"), width = "80%")
        )
      )
    navset_card_pill(!!!nav_items, height = 360)
  })

  # 3. create the plots
  observe({
    walk(
      unique(penguins_filtered()$island),
      function(x) {
        id <- glue("plot_{x}")
        output[[id]] <- renderPlot({
          penguins_filtered() |>
            filter(island == x) |>
            ggplot(aes(x = year)) +
            geom_histogram(stat = "count") +
            labs(title = glue("Number of penguins by year for island {x}"))
        })
      }
    )
  })
}
shiny::shinyApp(ui, server)